
Predict Software Engineer Salary for free with AI (Deep Learning) based App
Abstract
Hi. Thank you for tuning in. Today we are presenting our first Artificial Intelligence (AI) based web application for software engineer salary prediction. We have used machine learning (ML) based deep neural network model to predict the salary of software engineers, based on their country, job title, company size, work-experience, and educational background. The survey data for this application is collecting from two publicly available sources, one is the Stack Overflow developer survey, and the other one is the survey data at aijobs.net. All data are collected for the year 2022 and 2023. The web app is fully responsive for all types of browsing devices and completely free to use. We appreciate your feedbacks to improve our applications and adding more features to them.
Try out the app from here
Table of Contents
In this post we will discuss the followings-
Salary of a software engineer may vary based on different factors. Location is one of the major factors. It also significantly relies on the stack, experience, and the educational background of the engineers. It may also rely on different other factors like the job-type (category), and company-size. Age of the engineer can also be an important factor. Therefore, it is essential to know the influence of all these parameters to efficiently predict the typical salary a software engineer. So, to achieve reliable performance from a machine learning model, a sophisticated pipeline design for data analysis and model hyper-parameter tuning is required.
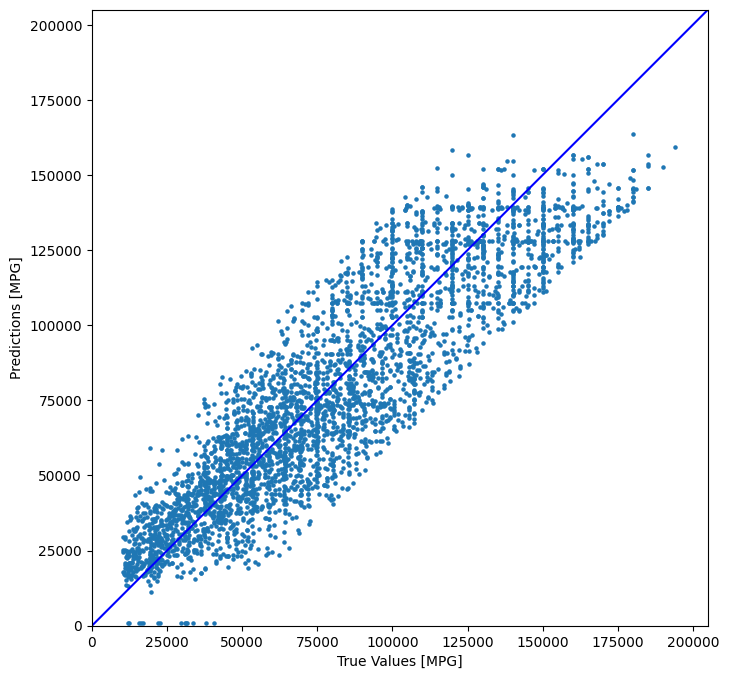
The Machine Learning (ML) model that we finally came up with, for the App, was able to predict the annual salary of 4600 software Engineers from 46 different countries and 22 different Job Titles, with an average absolute-error range of around 20,000 USD. Within these 4600 test samples, nearly 1600 samples were predicted within an average error range of around 10,000 USD. One point to be considered here, is that the salary rangers do not follow any universal pattern across all countries and companies. Therefore, it is quite common to find outliers or exceptions among the available data-points. Our goal is to remove those outliers from the collected survey data, so that the ML model can reliably predict the typical salaries.
Now let us walk you through the data analytics pipeline that we designed for this particular application. Data wrangling and processing is arguably the most deliberate and time consuming part of any MLOps pipeline. This particular pipeline however, includes different stages of wrangling operations, such as data collection, data preprocessing, data cleaning, feature engineering, data post processing and then storing. The two publicly available data sources that we used were the stack overflow developer survey, and the aijobs.net survey data. we collected data from both sources for the year 2022 and 2023. All data points were collected for full-time jobs only, and then the outliers were filtered by removing the samples that were outside the 10K to 200k salary range, which was around 5% of the available samples.
The feature engineering task was mostly done by categorizing some of the most import parameters having ordinal characteristics, such as, the work experience (in years), company-size, and the job title column. For example, from the experience (in years) column we created a new ordinal column: experience (level) with four different categories such as entry level (0-3 years), mid-level (4-8 years), senior level (9 to 15 years), and executive level (above 15 years). we also reduced the dimensionality of the company size column by clustering the number of samples into three simple categories, and they are: small (0-100K people) medium (100-5K people) and large (above 5K people).
We also prepared another categorical column called job type from the job title column by clustering similar job titles as the same job-type. For example, all types of Developers such as front-end, back-end full-stack or game/graphics developers are clustered under the developer category in the job type column. Similarly, all the job titles that requires data analytics, such as data scientists, data analysts, data engineers, and machine learning engineers are all put into the same category. different job titles with managerial roles, such as project managers, product managers, data managers, or overall engineering managers are clustered together as managers category in the job type column. different job titles that are related or close to devOps such as the devOps specialists, system administrators, security professionals, and site reliability engineers are also clustered together as the same category in the job type column. These new features helped improving the understandability of the survey data and exploring the underlying hierarchy among the data points in terms of different parameters. When trained with this cleaned and processed data, it subsequently improved the prediction performance of the machine learning model.
It was insured that there is no data sample having missing value for the salary parameter. missing values for other parameters were filled up by taking the median or the maximum count (depending on the parameter type: continuous or categorical) for the corresponding group of the country and job title combination. After cleaning, preprocessing, feature-engineering on this data, we ended up having around 60,000 samples with nine parameters or indicators to predict salary from. Then from this processed data, we filtered out all those country and job title combinations for which a significant amount of data samples (at least 30) was available. Around 90% of these samples were used to train and validate the machine learning model. The remaining 10% was used for testing model performance.
Then before training the ML model, all ordinal and categorical columns went through label encoding and one hot encoding respectively. As the country and the job title parameter were having a significantly High number of categories (46 and 22 respectively), we ended up having a significantly large number (77) of columns after the encoding operation. these large number of input parameters was one of the biggest reasons for us to choose the Deep neural network as the machine learning model for predicting salary. as the Deep neural network can handle the data dimensionality well (due to its hidden-layer architecture and regularization technique) compared to other conventional machine learning models.
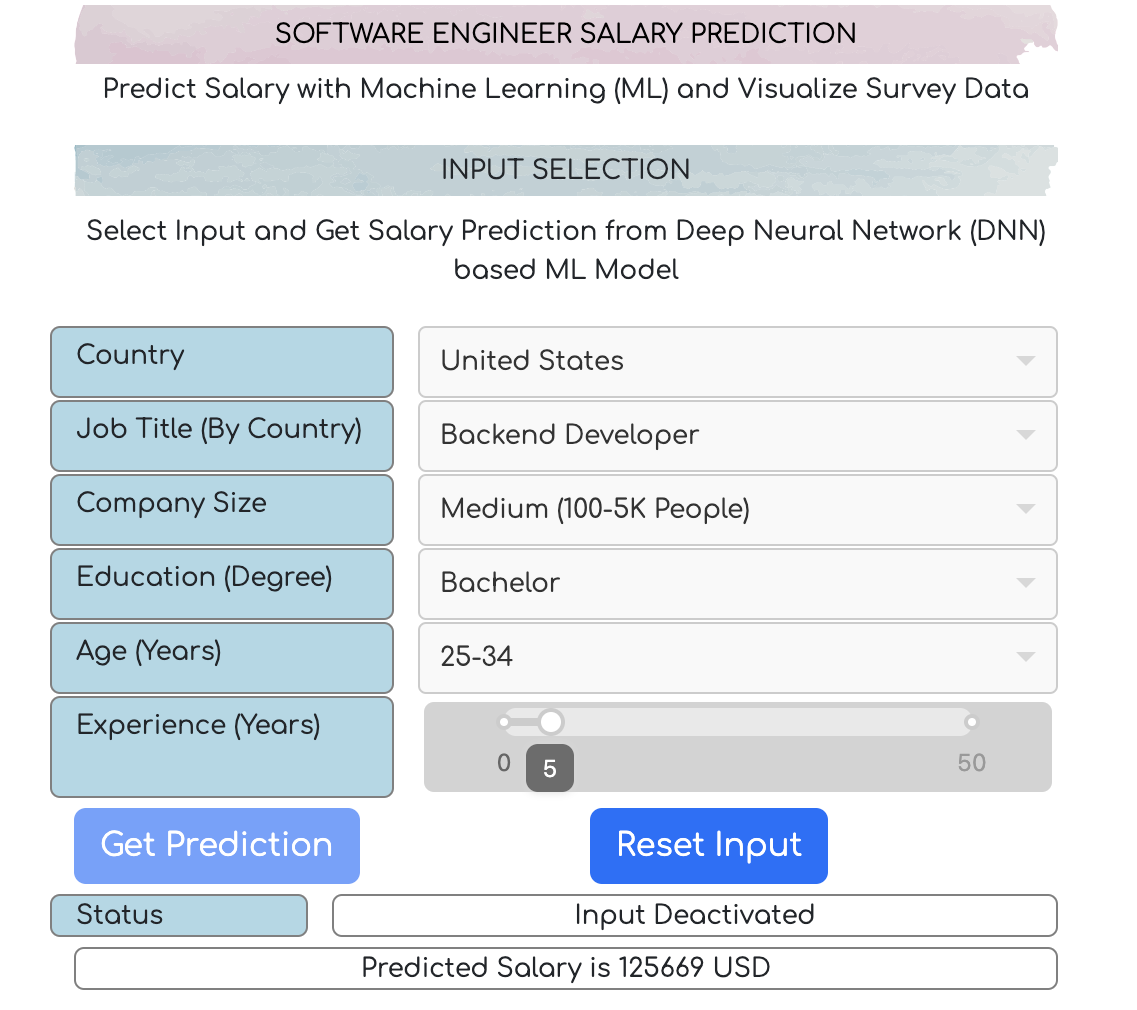
Now let us demonstrate the features and functionalities of the SWE salary prediction application.
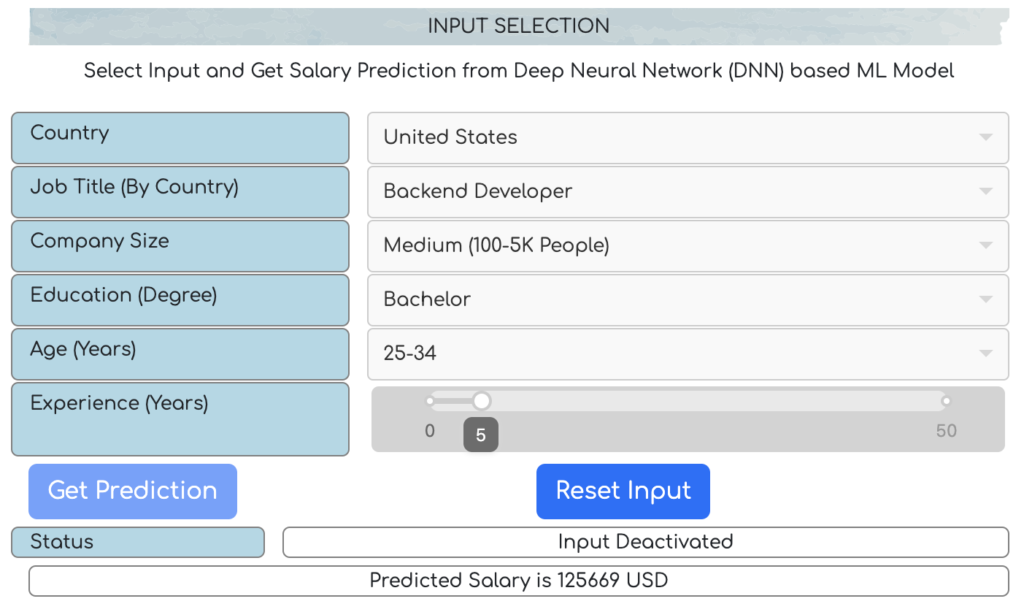
Inside the application, there are two sections. The first section is for input selection, and the second section is for survey data analysis and visualization. The prediction option itself is part of the first section. However, when the country and job title information inside the input selection section is changed, the graph-plots are updated accordingly in the salary analysis section. Therefore, by simply updating the first two input fields (country and Job Title) the users can update the corresponding graph plots, and visualize different types of Analytics available in the second section.
Speaking of the input selection section, there are several other fields available alongside country and job title, such as, company size, education, age-range, and experience (in years). Among these parameters, only the experience (in years) is continuous, and the remaining ones are all categorical (Categorical parameters along with corresponding categories are listed at the Appendix section at the bottom of this article).
One point to be mentioned here, is that the options for job title parameter update themselves according to the country selection. Therefore, if user changes the country in the app, the options for the job title will be reset according to the selected country. it is due to the fact that for all job titles and Country combinations, the corresponding survey data samples were not available or adequate. Although technically, the machine learning model can predict the salary for unknown combinations (not observed in the training data) of job title and Country, we intentionally prevented such prediction in our application, so that the prediction becomes always reliable, and it can be backed up by the available data samples, visualized in the salary data analysis section. In future, if we expose an API, we will incorporate all types of selection functionalities.
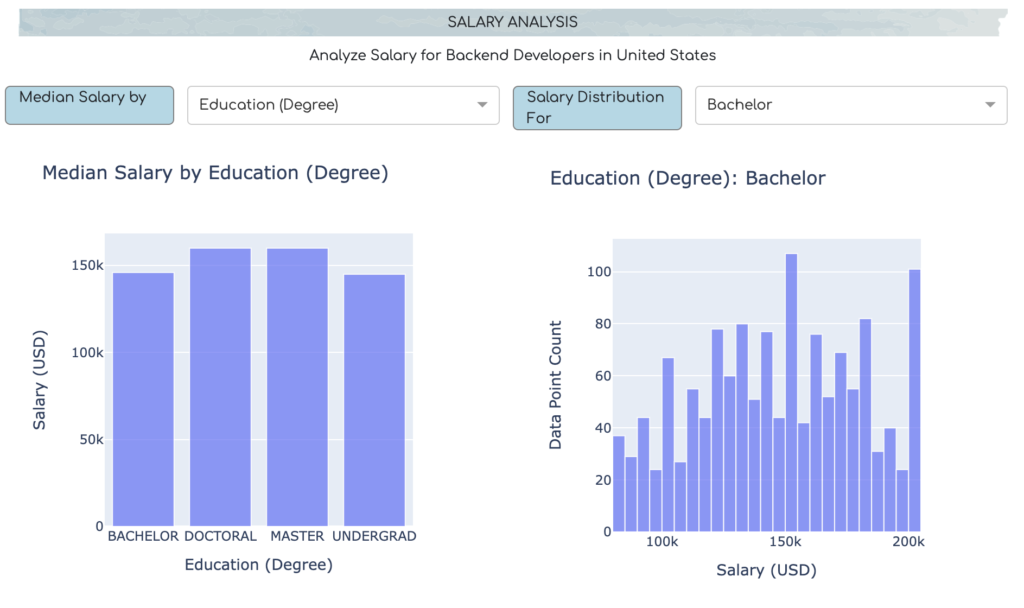
The salary analysis and visualization section basically shows two different types of bar-plots. The first plot shows the median salary for a specific country and Job-type combination, based on different parameters that may have significant influence on the salary, such as education, work experience level, age and remote work status. The second plot is basically an extension of the first plot. It shows a histogram of available survey data samples, based on the selected category, under the parameter chosen for the first plot.
For example, if user select age group parameter to visualize the median salary for different age groups in the first plot, then in the second plot, user will be able to see the histogram of available survey data samples, for any particular age-group user prefers. However, these plots will be shown for one combination of country and job title at a time, based on the selection of those parameters in the input selection section.
Now let us discuss about the prediction mechanism. In the SWE salary prediction application, there are basically two buttons, get prediction and reset input. by default, the reset input button stays disabled. ones user updates the input fields accordingly and then presses the get prediction button, all input fields are locked (disabled), the machine learning model makes the prediction in the back-end, and the result is shown in the UI. once the prediction result is available, the reset input button is enabled, so that the users can reactivate the input fields and make a new prediction.
Country
Argentina| Austria| Australia| Belgium| Bulgaria| Brazil| Canada| Switzerland| Chile| China| Colombia| Czechia| Germany| Denmark| Estonia| Spain| Finland| France| United Kingdom| Greece| Croatia| Hungary| Ireland| Israel| India| Iran| Italy| Japan| South Korea| Lithuania| Mexico| Netherlands| Norway| New Zealand| Poland| Portugal| Romania| Serbia| Russian Federation| Sweden| Singapore| Slovenia| Turkey| Ukraine| United States| South Africa
Job Titles
Backend Developer| Frontend Developer| Full stack Developer| Desktop App Developer| Data Science Or Ml Specialist| Mobile App Developer| Data Engineer| DevOps Specialist| Engineering Manager| Cloud Infrastructure Engineer| Embedded Systems Developer| Site Reliability Engineer| Data Analyst| Data Scientist| Business Intelligence Engineer| Data Architect| Data Manager| Developer Qa Or Test| Game Or Graphics Developer| Machine Learning Engineer| Security Professional| System Administrator
Remote Work Types
Not Remote | Hybrid | Full Remote
Education (degree)
Bachelor| Master| Undergrad| Doctoral
Company Size
Medium | Large | Small
Age Range(in years)
25-34 | 18-24 | 35-44 | 45-54 | above 55 | below 18
The Software Engineer Salary Prediction App is one of the most tested application we have deployed in the Analytical Man platform. At the same time, we have focused on the robustness, simplicity and the user-friendliness of this application significantly. We appreciate your feedbacks and suggestions on improving its features. Let us know your ideas and thoughts on this app or any other analytical problem you like. Your feedback is always valuable to us.
Try out the app from here.